Exploiting logs in Azure
Logs sent by Application Insight to Azure can be accessed from the Overview of an Application Insights repository using the Search button.

Here you can see all the received requests to the servers, exceptions, web pages accessed by users, application traces, and access to external dependencies over a given period.
Warning
Some privacy / ad-blocking browser plugins can block Application Insights from sending client-side logs to Azure.
Check your browser dev tools if you cannot find logs coming from the client (like Page view logs for example) on Azure.

Filtering
Filtering by trace ID
When using Neos, if an error occurs, an error popup is displayed. In this popup, details can be displayed. They contains additional information about the error including a Trace ID.
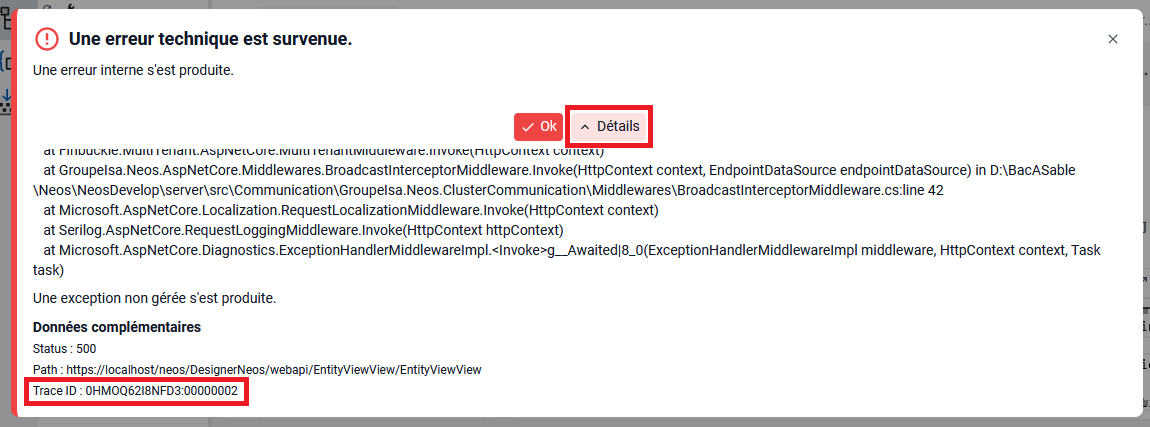
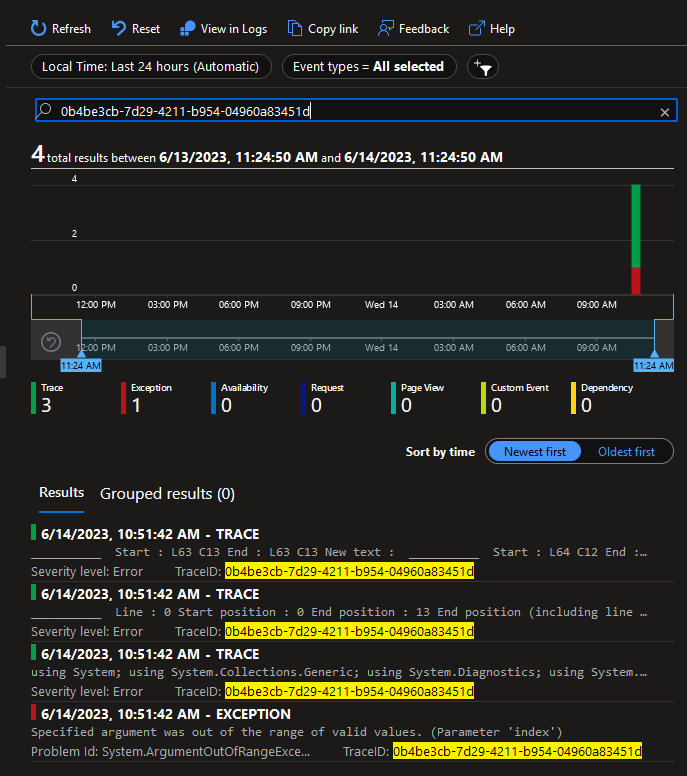
This ID can be used to filter logs using the search bar and be able to see all the events that lead to the error. You can also use the Investigate > Transaction search menu which allows you search for the transactions of your application or the different type of telemetry in your application.
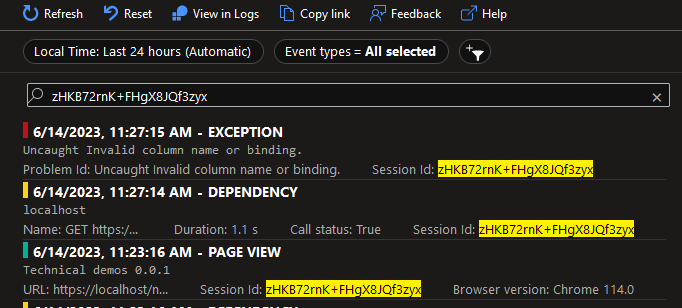
Filtering by session ID
When a user uses a Neos application from their browser, a session identifier (Session ID) is generated. By filtering with this ID, you can retrieve all the operations that the user has performed between the time they opened and closed the application.
Filtering by computer name
If you know the name of the computer from which originates a log, you can also use it to filter the logs. The name appears in the Role instance property of the logs.
Log details
When clicking on a log you will have access to its details.
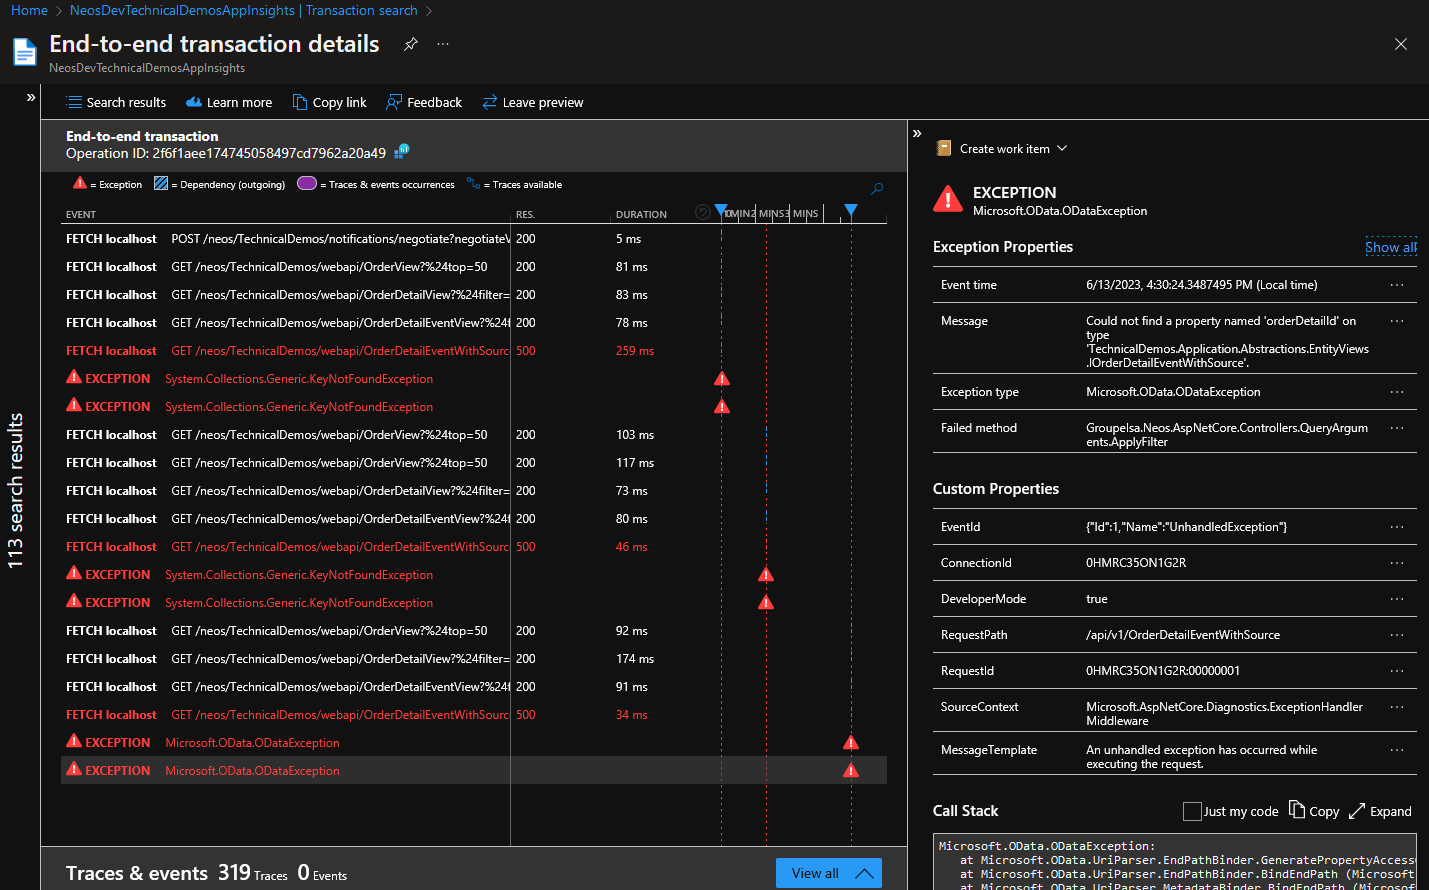
On the left, you can see the timeline listing all the events that lead to the log you selected. From there, you can easily switch to another log and display its details.
On the right, you can see different information depending on the type of log you selected. For example, you will be able to the the call stack of an exception.
Neos automatically add custom properties to give you more information. Usually, you will find the cluster name and version as well as the part of the application that sent the log (generator, server or client).
Log analytics and queries
Monitoring > Log
Log queries in Application Insights allow you to retrieve and analyze log data collected from your application. These queries help you gain insights into the behavior and performance of your application by filtering and aggregating log data based on specific criteria.
The queries hub holds prebuilt example making it an ideal place to start. You can filter your queries according to resource type, category, topics and other tags to find what you need. Additional, when you viewing the logs for a single resource, we automatically apply filter to show you queries thar are relevant to the resource type that you are currently exploring.
Log queries enable you to write custom queries to retrieve specific logs based on your requirements. These queries are written using a query language called Kusto Query Language (KQL). With log queries, you can perform various operations on your log data, such as filtering, sorting, grouping, and aggregating. This allows you to narrow down the logs to a specific time range, specific users, specific operations, or any other criteria that are relevant to your analysis :
- Filtering: You can filter logs based on specific criteria, such as a particular time range, log level, or custom properties. For example, you can retrieve all logs generated by a specific component of your application or filter logs based on the severity level.
- Aggregation: You can aggregate log data to get summary information. This includes operations like counting the number of logs, calculating averages, or grouping logs based on specific properties. Aggregations help you identify patterns and trends in your log data.
- Joins and unions: You can combine log data from multiple sources or tables using joins and unions. This allows you to correlate logs from different parts of your application or combine logs from different instances.
For example, you can filter logs by session ID to retrieve all the operations performed by a specific user during a session. You can also filter logs by computer name to identify logs originating from a specific machine.
Once you have retrieved the logs using log queries, you can further analyze the data. Application Insights provides a rich set of visualization tools and options to help you understand the log data better. You can create charts, graphs, and dashboards to visualize trends, identify anomalies, and monitor the performance of your application. Visualizations help in identifying anomalies, trends, and patterns in your application's behavior. In addition to the built-in capabilities of log queries, Application Insights also allows you to export log data to external systems for further analysis or integration with other tools.
Finally, you can pin a query to dashboard or create alert rules based on log queries to get notified when specific conditions are met. This helps you proactively monitor your application and take action when issues occur.
Overall, log queries in Application Insights provide a powerful way to retrieve and analyze log data, helping you gain valuable insights into the behavior and performance of your application.
To find out more about log requests, please consult the Microsoft documentation :
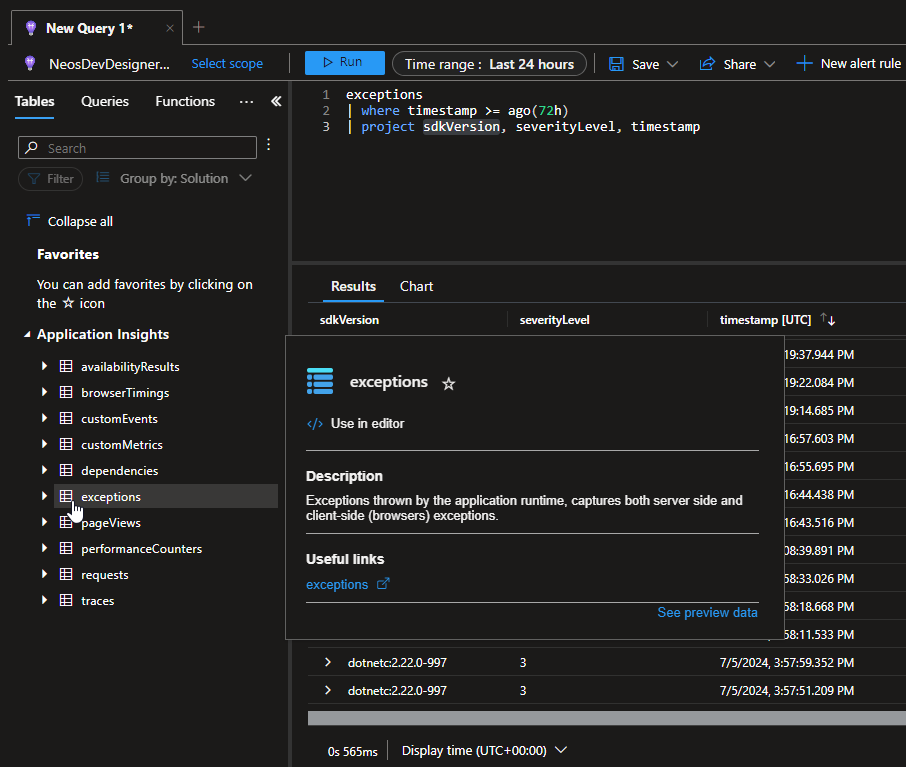
Examples KQL Query
Here's examples of KQL query:
// Only exceptions within the last 24 hours are included
// `project` operator is used to select and display the sdkVersion, severity level, and timestamp of each log entry
exceptions
| where timestamp >= ago(24h)
| project sdkVersion, severityLevel, timestamp
// Display exceptions that occurred on the front side
exceptions
| where cloud_RoleName == "NorthwindClient"
// Display exceptions that occurred on the server side
exceptions
| where cloud_RoleName == "NorthwindServer"
// Count of script errors by problemId over time
exceptions
| where timestamp > datetime("2024-07-08T11:34:00.000Z") and timestamp < datetime("2024-07-08T12:34:00.000Z")
| where cloud_RoleName == 'NorthwindClient'
| where client_Type == "Browser"
| summarize sum(itemCount) by problemId, bin(timestamp, 1m)
| render timechart
// Percentiles of page view duration over time
pageViews
| where timestamp > datetime("2024-07-08T11:34:00.000Z") and timestamp < datetime("2024-07-08T12:34:00.000Z")
| where cloud_RoleName == 'NorthwindClient'
| summarize percentiles(duration, 50, 75, 95) by bin(timestamp, 1m)
| render timechart
// Count of failed and successful calls over time
dependencies
| where timestamp > datetime("2024-07-08T11:34:00.000Z") and timestamp < datetime("2024-07-08T12:34:00.000Z")
| where cloud_RoleName == 'NorthwindClient'
| where client_Type == "Browser"
| summarize failed=sumif(itemCount, success == false) by target, bin(timestamp, 1m)
| render timechart
// 95th percentile of dependency duration by target over time
dependencies
| where timestamp > datetime("2024-07-08T11:34:00.000Z") and timestamp < datetime("2024-07-08T12:34:00.000Z")
| where cloud_RoleName == 'NorthwindClient'
| where client_Type == "Browser"
| summarize percentiles(duration, 95) by bin(timestamp, 1m), target
| render timechart
You can customize this query by modifying the filter criteria or adding additional operators to suit your specific requirements.
Note
You can click on a table to obtain information about the purpose of this table.
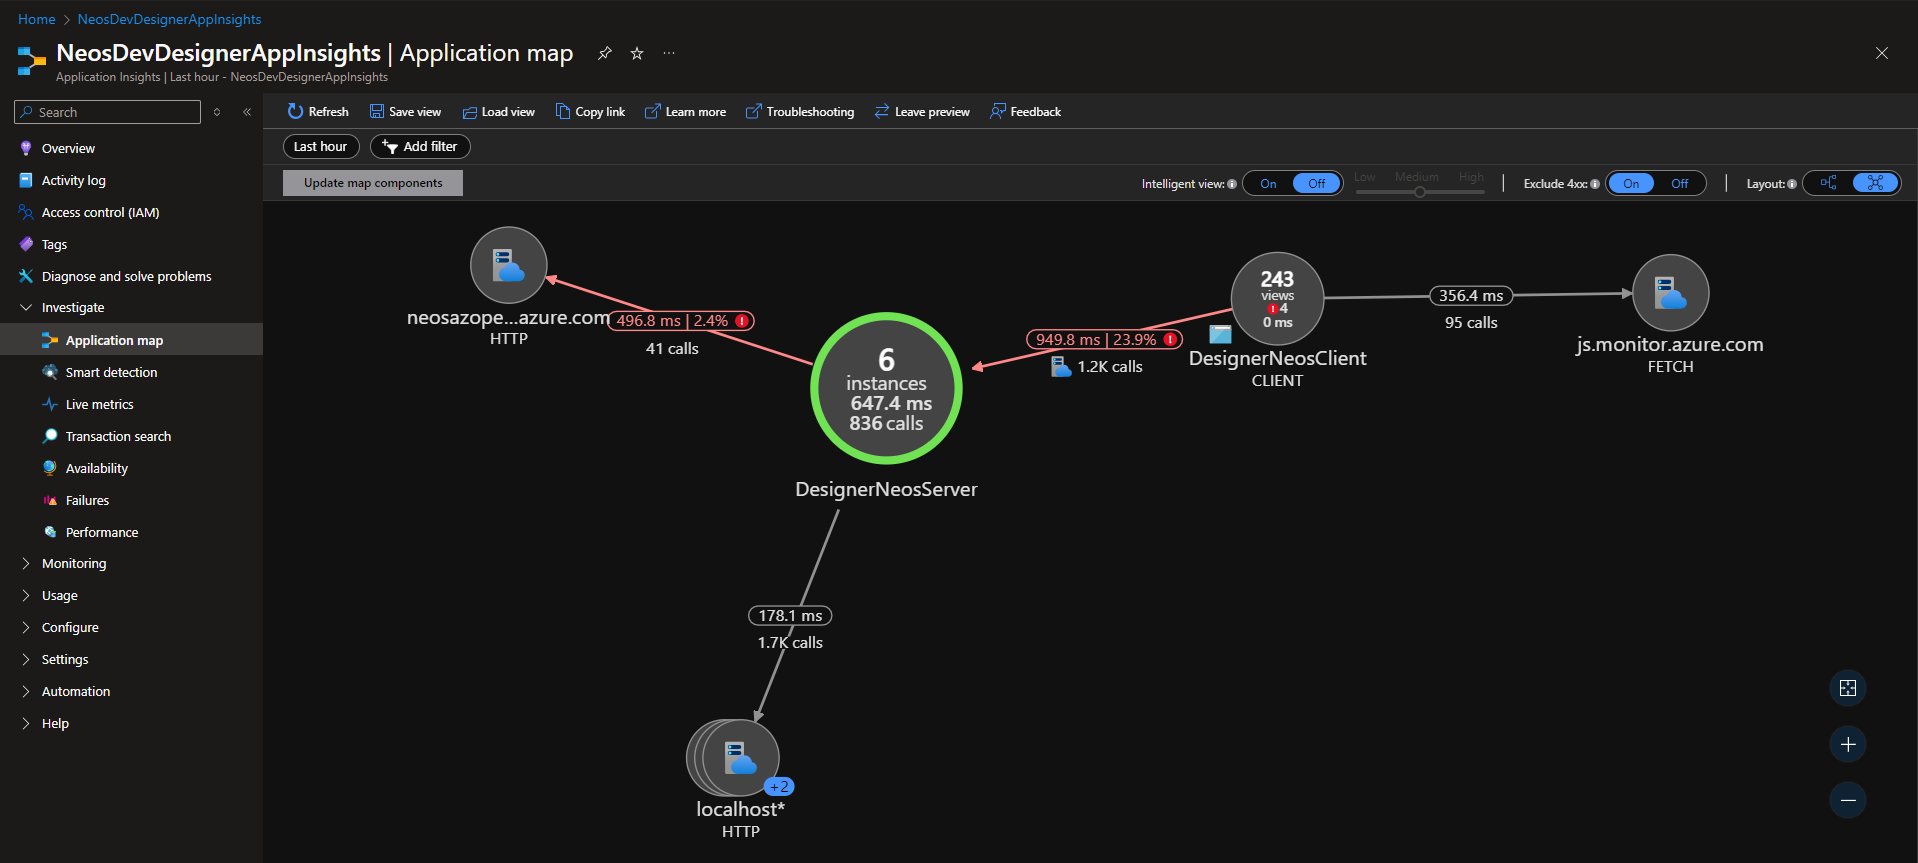
Application map
Investigate > Application map
Application map in Application Insights provide a visual representation of the components and dependencies of your application. These maps help you understand the relationships between different components and identify potential issues or bottlenecks in your application architecture. You can go deeper by clicking on a specific node.
To find out more about application map, please consult the Microsoft documentation.
Failures and performance views
Investigate > Failures
Failures view in Application Insights provide a summary of the exceptions and errors that occurred in your application. These failures help you identify issues that need attention and take corrective actions to improve the performance and reliability of your application. You can view detailed information about each failure, including the exception type, stack trace, and other. You can also filter and group failures based on specific criteria to analyze trends and patterns in your application.
Investigate > Performance
Performance views in Application Insights provide a summary of the performance metrics of your application like duration of your requests. These views help you identify performance bottlenecks, slow operations, and other issues that impact the user experience. You can view detailed information about the performance of your application, including response times, latency, and other metrics. You can also filter and group performance data based on specific criteria to analyze trends and patterns in your application.
To find out more about failures and performance views, please consult the Microsoft documentation.
Advanced functionalities
Availability tests
Investigate > Availability
Availability tests in Application Insights allow you to monitor the availability and performance of your application from different locations around the world. These tests help you identify issues that impact the user experience and take corrective actions to improve the reliability of your application. You can configure availability tests to run at regular intervals and receive alerts when issues are detected. You can also view detailed information about the availability and performance of your application, including response times, latency, and other metrics. You can configure an alert rule to get notified when the availability of your application falls below a certain threshold.
To find out more about availability tests, please consult the Microsoft documentation.
Smart detection
Investigate > Smart detection
Smart detection in Application Insights provide automatic detection of anomalies and issues in your application. These detections help you identify issues that impact the user experience and take corrective actions to improve the reliability of your application. You can configure smart detection rules to monitor different aspects of your application, such as performance, availability, and other metrics. You can receive alerts when issues are detected and view detailed information about the detected anomalies. You can also configure an alert rule to get notified when anomalies are detected.
Monitoring > Alerts
Alerts in application insights allow you to create alert rules based on specific criteria to get notified when issues occur in your application. You can configure alert rules to monitor different aspects of your application, such as performance, availability, and other metrics. You can receive alerts via email, SMS, or other channels when issues are detected. You can also view detailed information about the alerts and take corrective actions to improve the reliability of your application.
To find out more about smart detection and alerts, please consult the Microsoft documentation.