Distributed Tracing
Overview
Distributed tracing is a method used to monitor and observe requests as they flow through distributed systems. It helps in understanding the performance and behavior of applications by tracking the path of requests across various services.
OpenTelemetry
Neos uses OpenTelemetry for distributed tracing. OpenTelemetry is a set of APIs, libraries, agents, and instrumentation to provide observability for applications. It supports various backends for storing and analyzing trace data.
For more information about OpenTelemetry, you can visit the OpenTelemetry website.
Jaeger
Neos uses Jaeger as a backend for distributed tracing.
Jaeger is a popular open-source distributed tracing system that is used to monitor and troubleshoot microservices-based architectures. It provides a way to visualize the flow of requests and identify bottlenecks in the system.
For more information about Jaeger, you can visit the Jaeger website.
Development using Jaeger
Jaeger is installed by default in the Neos development environment by using the command:
neos setup
From the version 2.4.0, Jaeger V2 is installed by default. Otel Collector is also installed to collect Zipkin Dapr traces from previous Neos version and send them to Jaeger.
You can launch Jaeger by the link in the management page or by the address http://localhost:16686.
If you need to customize the local Jaeger or OpenTelemetry Collector configuration files, see Customize the local collector, Jaeger and Prometheus.
Find traces
During development
During development, you can view traces using the management page launched with the command neos run.
For each HTTP request, a link to the corresponding trace in Jaeger is displayed when you select the request from the list.
This makes it easy to access and analyze trace details directly from the development interface.
From a http request in the browser
To find traces from a HTTP request in the browser, you can use the following steps:
- Open the browser and navigate to the page you want to trace.
- Open the developer tools (F12).
- Go to the "Network" tab.
- Perform the action you want to trace.
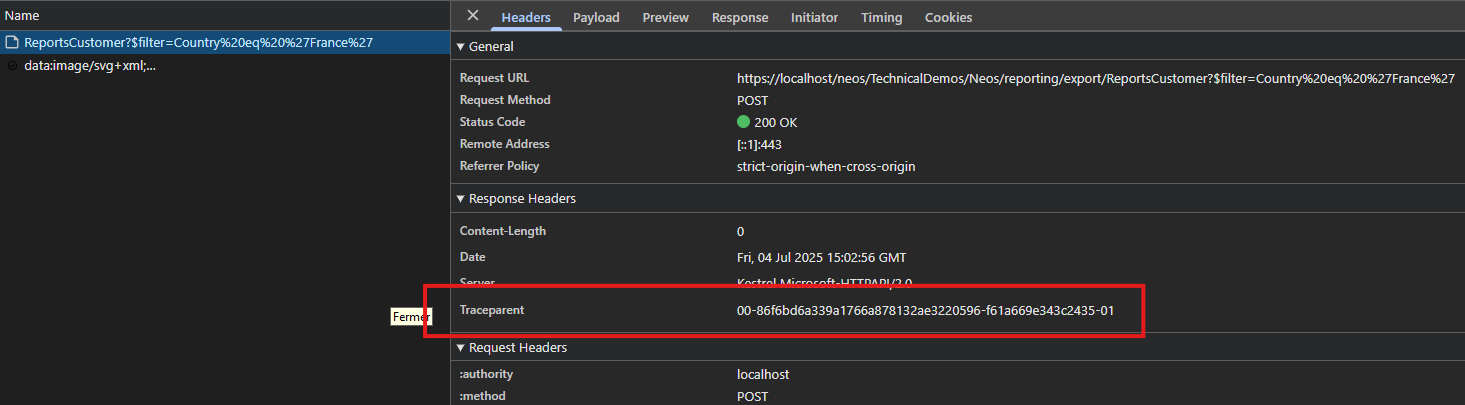
- Look for the request in the list of requests.
- Look for the
traceparentheader in the response. This header contains the trace ID and span ID. You must copy only the trace ID.
Example of a traceparent header:
traceparent: 00-86f6bd6a339a1766a878132ae3220596-f61a669e343c2435-01
The trace ID is 86f6bd6a339a1766a878132ae3220596.
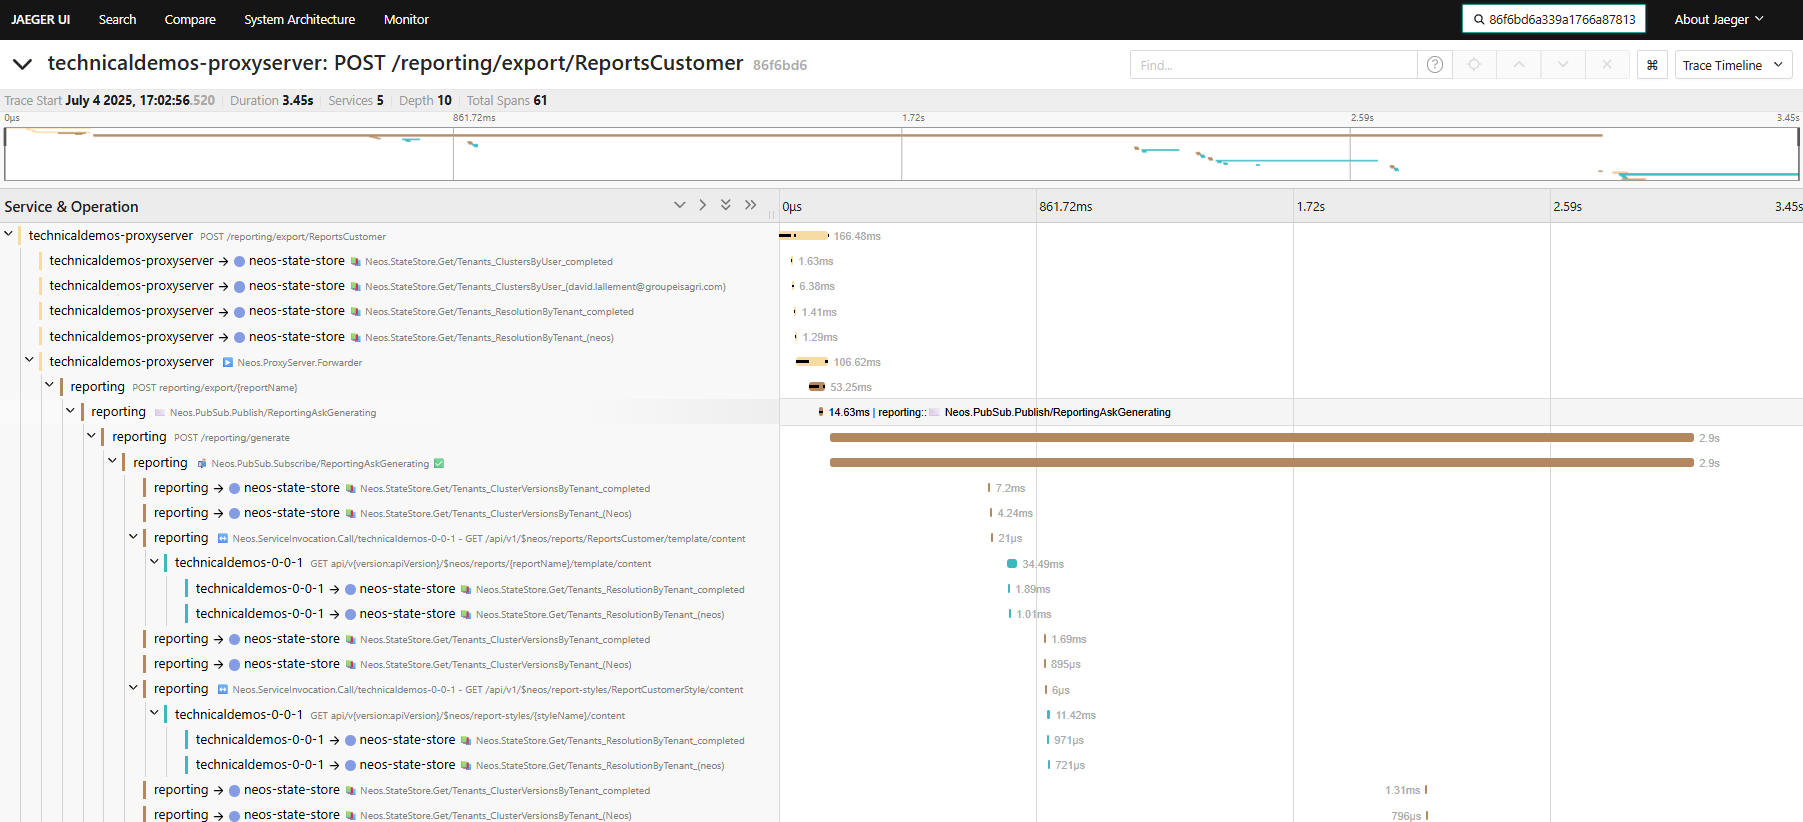
- Go to the Jaeger UI and paste the trace ID in the search bar.
From a tag
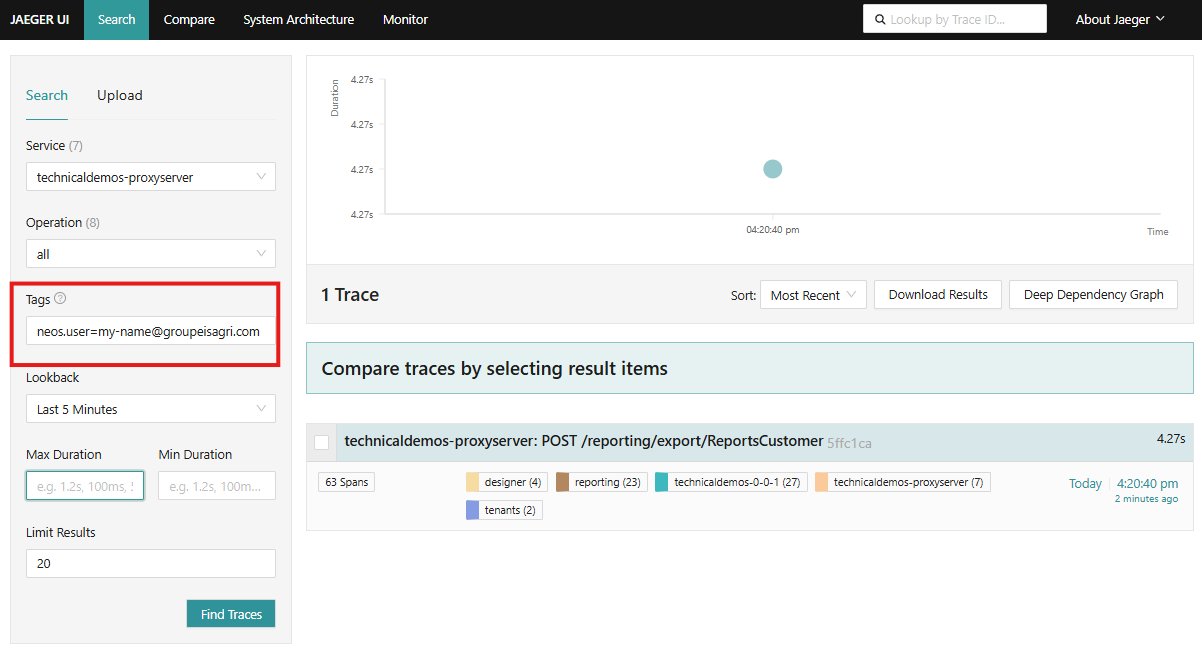
To find traces from a tag, you can use the following steps:
Open the Jaeger UI.
In the search panel, enter the tag you want to search for. For example, if you want to search for traces with the tag
neos.user, you can enter[email protected].Click on the "Find Traces" button
Using the Neos tracer in business code
Neos provides the INeosTracer interface to create custom tracing activities in your business code. This allows you to add detailed spans for specific operations, making it easier to debug and monitor your application.
For detailed information on how to use the tracer, including code examples and best practices, see Neos tracer.
Retrocompatibility
Neos 2.4.0 introduces a new version of Jaeger (Jaeger V2) and OpenTelemetry.
The new version is not compatible with the previous version because the trace was exported in Zipkin format.
To ensure retrocompatibility, the Otel Collector is installed to collect Zipkin Dapr traces.
If you ran the command neos setup of the version 2.4.0 and have run a cluster, the new Jaeger V2 is installed and running, then if you run a cluster with the previous version, the traces will be collected by the Otel Collector and sent to Jaeger V2.
If Jaeger V2 is not running, when you run a cluster with the previous version, Jaeger V1 will be running if it has been installed before else you can run the command neos setup to install Jaeger V1.