Debug UI Application
Browser Developer Tools
Browser Developer Tools are a set of web authoring and debugging tools built directly into modern web browsers. They allow developers to inspect the DOM, modify styles on the fly, debug JavaScript/TypeScript code, and monitor network activity. You can open these tools by pressing F12 or right-clicking anywhere on the page and selecting "Inspect".
In the context of Neos, the most useful panels are:
- Elements: Allows you to view and modify the HTML and CSS of the page. This is useful for inspecting the structure of your UI components and testing style changes.
- Console: Displays errors and logs. It also allows you to interact with the running application using JavaScript commands. This is where you can use helper functions like
neos.vm($0)to inspect view models. - Sources: Used for debugging JavaScript and TypeScript code. You can browse files, set breakpoints, and step through your code execution.
- Network: Shows all network requests made by the page. This is essential for verifying that your API calls (queries, saves, etc.) are being sent correctly and returning the expected data.
Logs
You can enable additional client-side logs by adding the debug search parameter to the application URL.
Examples:
https://localhost/neos/Northwind/?debughttps://northwind.neos.groupeisagri.com/?debug
This enables extra messages in the browser console, especially hidden debug logs for the execution of UI event rules and validation rules.
Tip
When an error occurs in the console, the call stack is displayed. If you recognize one of your UI view files in the stack trace, you can click on it to jump directly to the line of code that caused the crash. You can then set a breakpoint on that line and trigger the error again to inspect the variables and understand the root cause.
Debugging API calls
The Network tab is particularly useful for diagnosing issues with server communication. To use it effectively:
- Open the Network tab.
- Filter by Fetch/XHR to see only API requests.
- Perform the action in the UI that triggers the API call.
- Click on the request in the list to view its details.
- Headers: Check the request URL and HTTP method.
- Payload: Verify the data being sent to the server (JSON body).
- Preview/Response: Examine the server's response. If the request failed (red status), the response often contains an error message explaining why (e.g., validation error, internal exception).
See also
Debug UI code
The C# UI code are translated into Typescript. You can debug the TypeScript code in the web browser development tools (F12 on Chrome/Firefox).
Firstly, you need to open the UI view you wish to debug.
Then, in the Sources tab of the browser development tools, you can find the files relating to the UI view via the tree : localhost > neos > {ClusterName} > src > views > {UIViewName}.
The directory contains :
- resources
- {UIViewName}Actions.ts
- {UIViewName}Computeds.ts
- {UIViewName}EventRules.ts
- {UIViewName}Methods.ts
- {UIViewName}PreValidationRules.ts
- {UIViewName}Properties.ts
- {UIViewName}ValidationRules.ts
- {UIViewName}.ts
- {UIViewName}ViewModel.ts
- {UIViewName}.vue
Note
You can also find all the files related to the UI view by pressing CTRL+P in the Sources tab and searching by the name of the UI view.
In the {UIViewName}Methods.ts file, you'll find all the methods transpiled in TypeScript. You can put breakpoints wherever you like. It is the same for the event rules, validation rules and pre validation rules.
Debug UI expression
The expressions of the properties can be found in the {UIViewName}Properties.ts file. This file contains a class for each property.
For example, to find the visibility expression of a property, you can open this file and search the property name in the content (CTRL+F). You should find the class that describes the property which contains a getVisible method with the expression.
It's the same principle with the expressions of the actions in the {UIViewName}Actions.ts file.
The UI view expressions (Title, Creation Allowed, etc.) can be found in the {UIViewName}ViewModel.ts file. This file contains a class describing the UI view. You can search the name of the expression in its contents to find it (CTRL+F).
Debug component binding
Get the underlying view model
Open development tools on your navigator, then select an element in order to inspect it.
This element can be accessed in the console by typing $0.
Each node of the html document is generated by a component.
This component use a view model which can be accessed via the neos.vm(element) function where element is the html node.
Here is an example of inspecting the view model of the InputNumber component in the Chrome browser:
Inspect the node "input" :
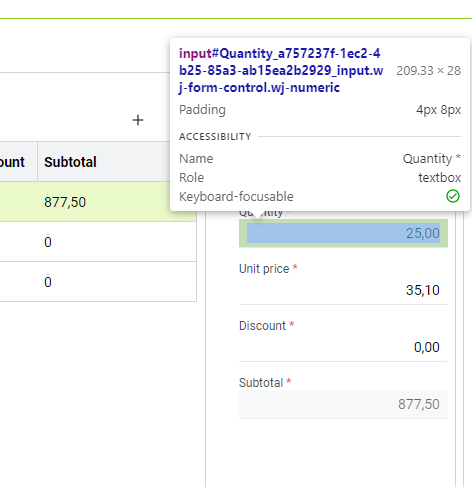
In the chrome console enter
neos.vm($0)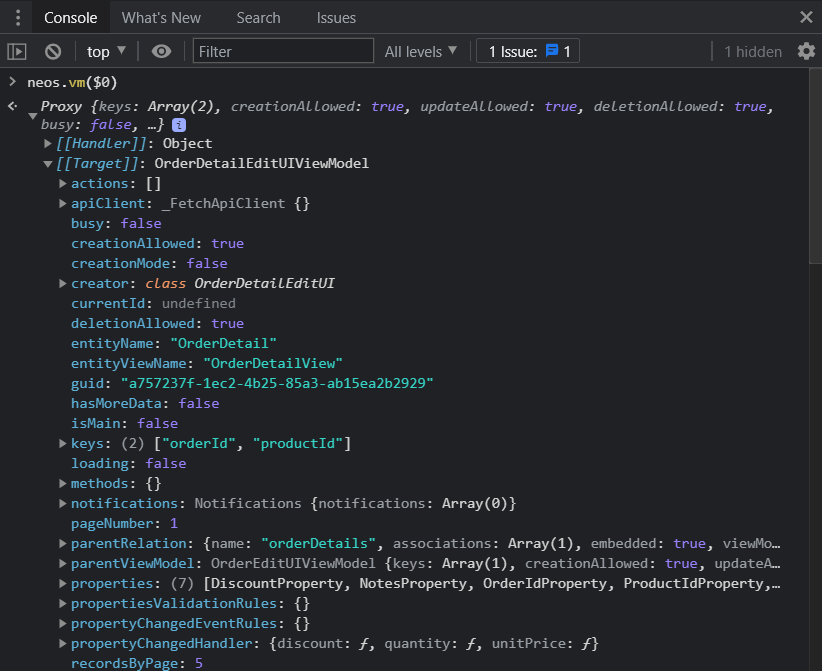
Note
neos.vm returns a proxy to the view model. For more information on proxy see proxy.
For example, to obtain the item at the current position in the datasource you can enter neos.vm($0).current
Get the underlying root view model
For example, in a master/detail UI view (eg: Order/OrderDetail), neos.vm($0) on a DOM element of the detail part will provide the view model of the detail.
To get the parent (master) view model we can use neos.vm($0).parentViewModel. If this view is used in the detail of another view, then we would write neos.vm($0).parentViewModel.parentViewModel to get the root view model.
More simply, the neos.rootVm($0) will get the root view model of the current frame directly.
Display the target of a proxy
The function neos.toJS(proxy) returns a copy of the proxy target. This way you can view the content of a proxy more easily. For example to display the item at the current position in the datasource you can enter neos.toJs(neos.vm($0).current).
Warning
neos.toJs does not return the target of the proxy but a copy. Changing properties of this object will not affect the real object.